
The combination of being at home for more than a year because of the Covid pandemic and returning to normal life while the virus has not been defeated, makes us all aware of the quality of our environment. Temperature, air quality and humidity are all critical to our well-being and need to be checked at regular intervals to assure we are not taking any health risks. M Cloud consultant Bart De Pooter has worked on a Proof of Concept (PoC) and shares it with you below.
For this PoC, I chose to monitor the temperature in a sudden room (can be placed anywhere). We handle all data as much as possible on Microsoft Azure.
When talking about IoT, we typically use words as ‘publisher’, ‘subscriber’ and ’broker’. The ‘publisher’ is the one creating the data and making it available for ‘subscribers’ that can read and interpret the data. The process of collecting the data on one side and making the data available on the other side is done by a ‘broker’.
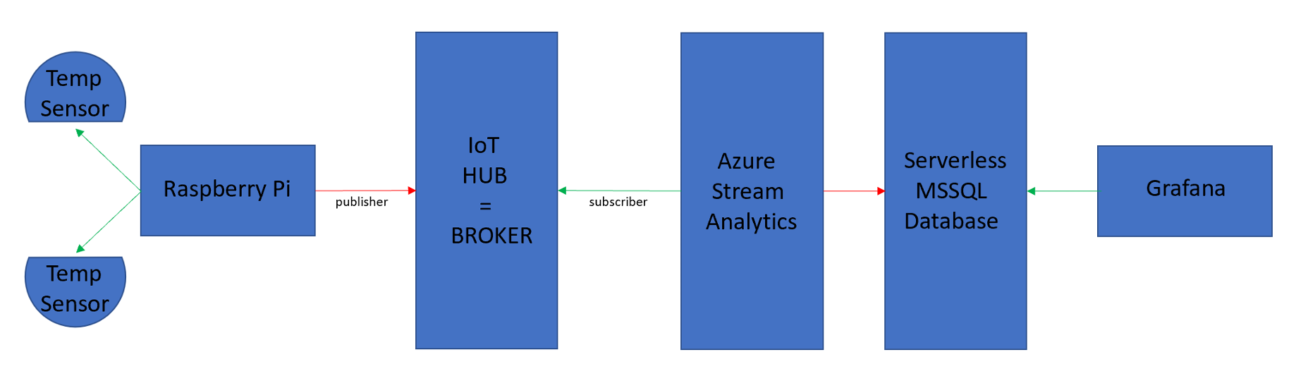
Three pillars in this PoC:
- The local device provides the data = ‘publisher’
- Microsoft Azure takes care of the collection of the data and ingestion in a database
- We use Grafana for data visualization
These three pillars provide one complete solution – from the sensor gathering data to the visualization of that data. And if necessary, alerting based on sudden thresholds that you can define.
I will not elaborate too much on every topic to keep this post readable. Let’s go!
The local device
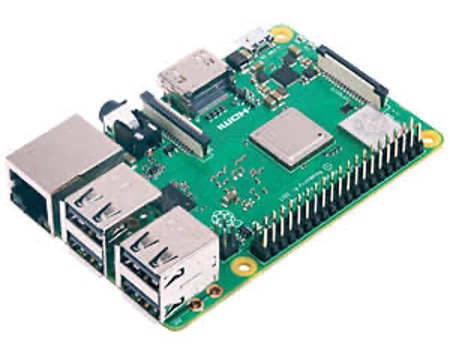
This can be anything that is able to communicate with the Azure IoT Hub. I chose to use a Raspberry Pi, because it’s the most flexible. This Raspberry Pi should not be the latest edition at all, so I’ve used a Raspberry Pi 3B+ for this. A Raspberry Pi can run a normal Linux O.S. and has ethernet connectivity on board. You also have a broad mix of programming languages available, such as Python.
Since we want to gather data from our environment, we need sensors. These sensors can be connected to the on-board pins or through an USB interface. In this case, I used an USB to a 1wire interface. This makes it much easier to attach and detach the interface from the Raspberry Pi. The sensors of an USB to 1wire interface are all operating on a 1wire network. The latter only needs two wires if in parasitic mode (gets power through the data line) or three when powered from the 1wire network.

The 1wire sensors are very tiny and can be attached in almost every way (star topology, but topology, mixed topology).
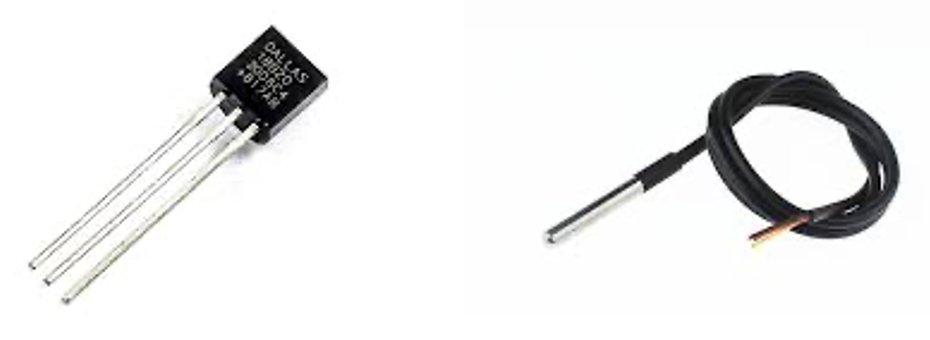
The first one is a normal 1wire temperature sensor, the second one a waterproof version.
For this PoC I attached two 1wire sensors connected by a normal cat5e utp network cable (any cabling goes). I chose two sensors that are connected almost next to each other, just to be able to check the precision of such a temperature sensor. The results sometimes vary, but in this case, they were both identical.
To transfer the raw data from these sensors, I created a little Python script. Python can directly communicate with the 1wire network because of the modules that are available, and it can easily be imported into your code. The Python script starts on the boot-up of the Raspberry Pi, making it a set-and-forget thing.
Microsoft Azure
As mentioned, the Python script will transfer the temperature data in a JSON package to the Microsoft Azure IoT Hub. The IoT Hub acts as a broker here. It collects the data and makes it available for the subscribers (in this case the ASA service which we will discuss later).
If we put a monitor on the IoT Hub directly, we see the incoming JSON packets:
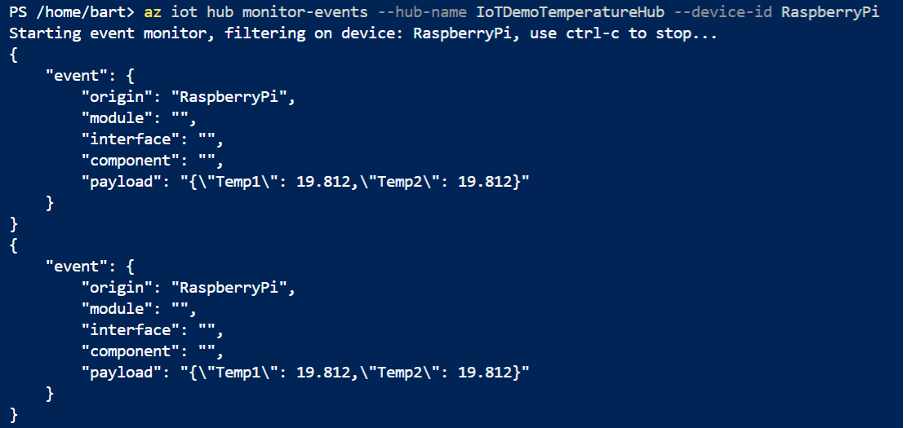
Since this is only a Hub, we need to use something to transfer this data and store it in a database. For this, we use the Azure Stream Analytics (ASA) service.
In Azure Stream Analytics we have inputs, processes and outputs. So obviously the IoT-Hub is the input and I decided to take Microsoft SQL Server as the output. Since this is one of the possibilities in ASA and also one of the possibilities of Grafana (our industry standard visualization tool which we will discuss later).
These three items are clearly visible in the ASA configuration page:
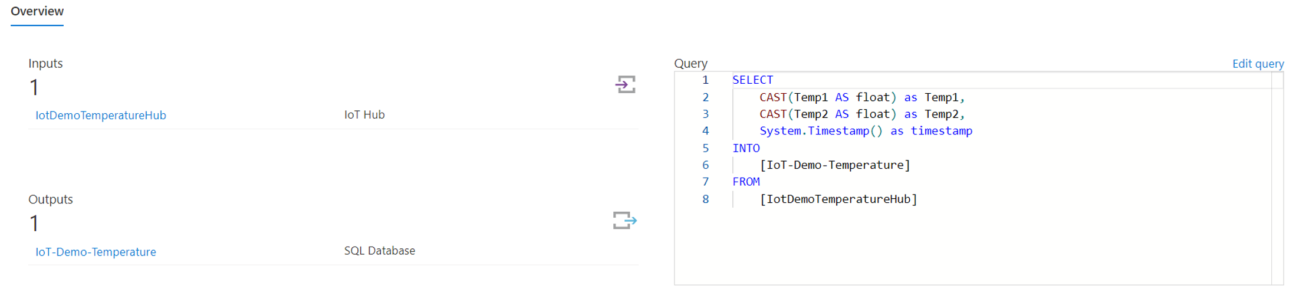
At the left we see the Input and the Output. At the right we see the Query, which takes the data out of the IoT-Hub and ingests it in the SQL database.
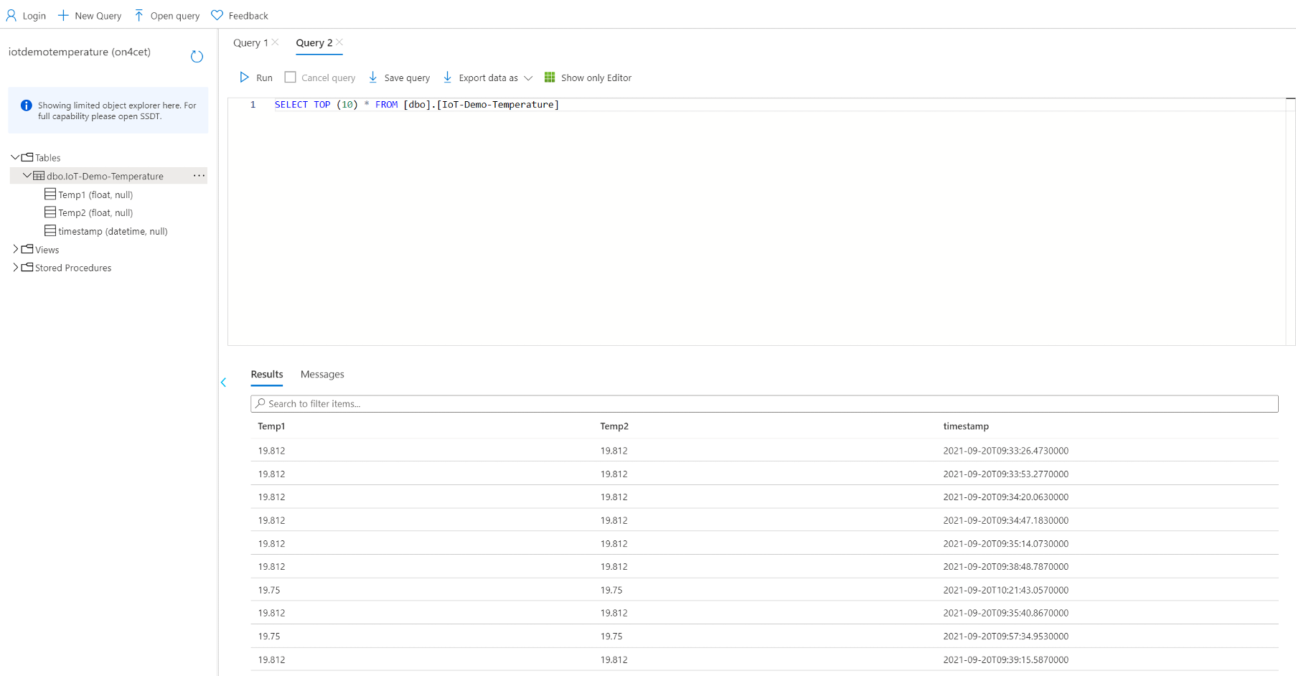
As we already discussed, the data finally goes into a Microsoft SQL Server database. I chose to use the Microsoft SQL serverless SaaS offering in Azure, since it is more than adequate for this purpose and quite cheap.

When we look at the database, we clearly see its structure and with a little query we see data ingested in the database:
Grafana
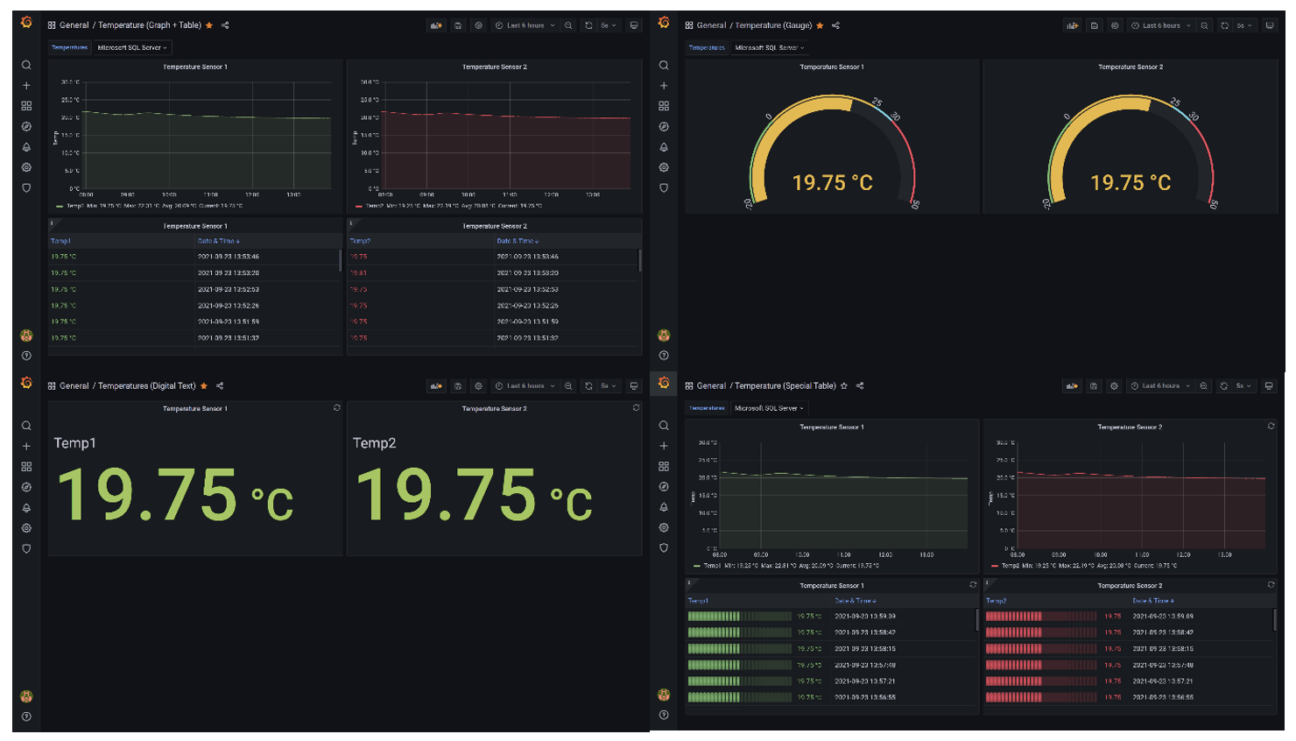
I used Grafana to visualize all data. Because this is somewhat of an industry standard and we want to keep everything in Azure, I created a Virtual Machine with a Red Hat Enterprise Linux O.S.. It is a very lightweight Virtual Machine (we don’t need SSD storage or 8 GB RAM) and because of that it is very economically priced ?
On this VM I installed the Grafana package and after some configuration we get the beautiful visualizations as we know from the tool:
This PoC is built to monitor temperature, but if you replace the temperature sensors with other sensors, you can measure literally everything: voltage, current, humidity, temperature, distance, air quality and light levels.
The PoC gives you a good idea of how an IoT project can be achieved and how it is easy to adapt to other situations – such as measuring CO² concentration in classrooms and public spaces. Even in an industry where temperature and/or humidity must be controlled, we can provide a solution.
With our solution, we can monitor the data and define sudden thresholds and actions that need to be taken, in order to restore the environment to acceptable levels.
Cost
One of the reasons to build a solution like this on Azure is the cost transparency. You can easily see the cost for every used component.
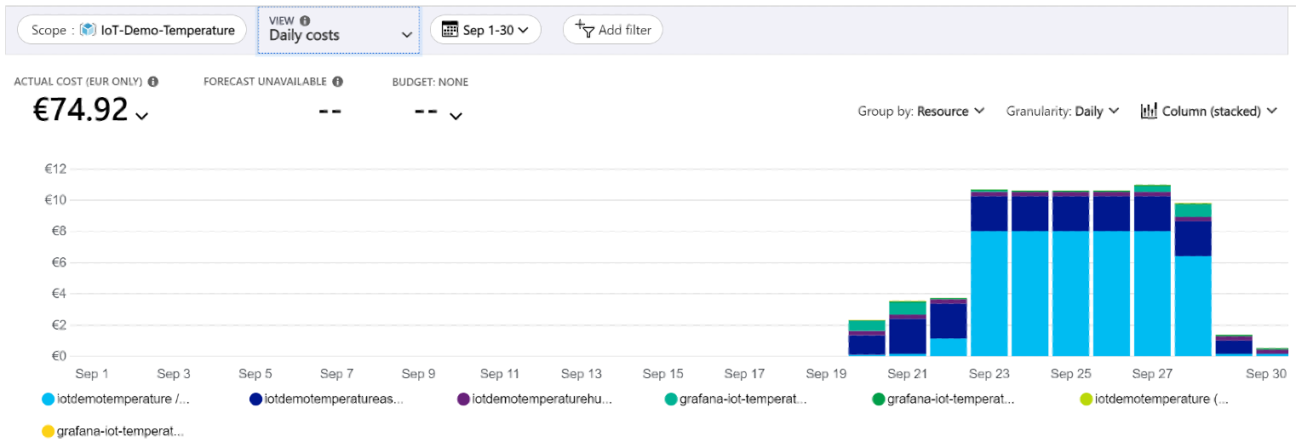
It is also very easy to keep the costs within your budget by defining the up- and downtime of some components. For a lot of the Azure services, you only pay for the time you use it. So if you schedule for example the Azure Stream Analytics service to go down after school is out, you can cut the cost of that service in more than half. Check out an example in the image shown above. Bringing down the ASA service, impacts the cost of the SQL Server service as well. You only pay when it is working, so that cost reduces to almost zero.
On the 29th of September the ASA service was stopped, bringing the cost from approximately 11 Euro to less than 2 Euro a day. If we configure our services to only run during business hours, we significantly save money. This would be more difficult if we had to buy all necessary hardware and host everything ourselves.
Right now, you can deliver IoT solutions going from one sensor to a few thousands, from one tenant to multi-tenancy and from a pub to a school with hundreds of rooms.
If you need help building an IoT monitoring solution, make sure to reach out!

