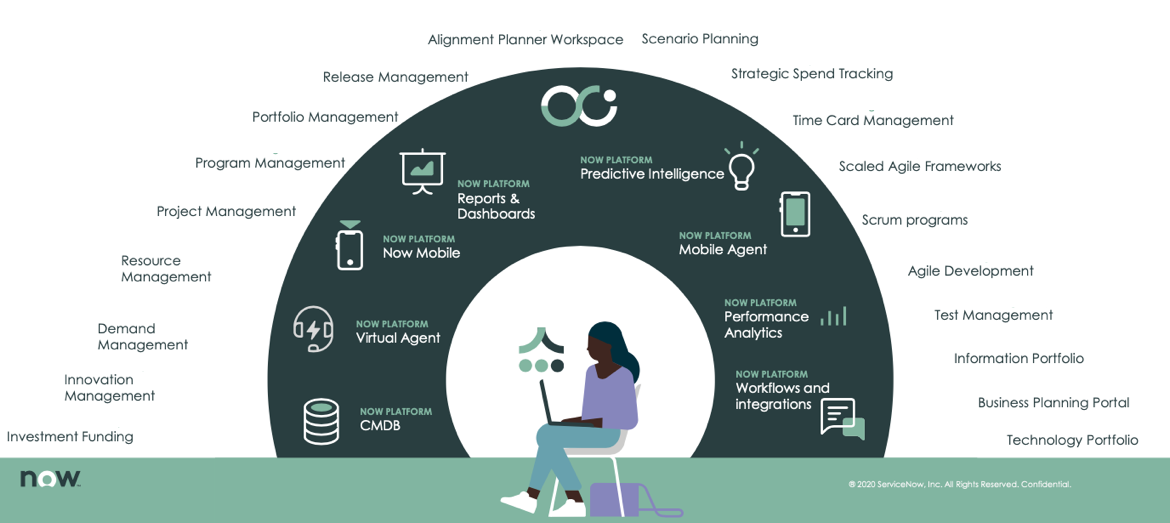
The new Tokyo release is in the spirit of enhancing the user experience that started in the previous release San Diego. In addition to engaging teams to increase workplace productivity with modern, intuitive, and personalized workspaces, ServiceNow Strategic Portfolio Management (SPM for short) has been improved in terms of reporting and data presentation to support strategic decisions of any organization.

Having said that, we will take you through the areas of improvement that we think will bring business users the most added value.
Alignment Planner Workspace
Although the Alignment Planner Workspace got its new look in the San Diego release, providing a single and actionable workspace to continuously align work to strategy to achieve our goals, there are new enhancements in terms of backlog ranking and drag-and-drop prioritization.
In addition to that, the workspace grid does not just display read-only information anymore. By double-clicking, you can now quickly adjust information, which makes the workspace more useful than ever before!
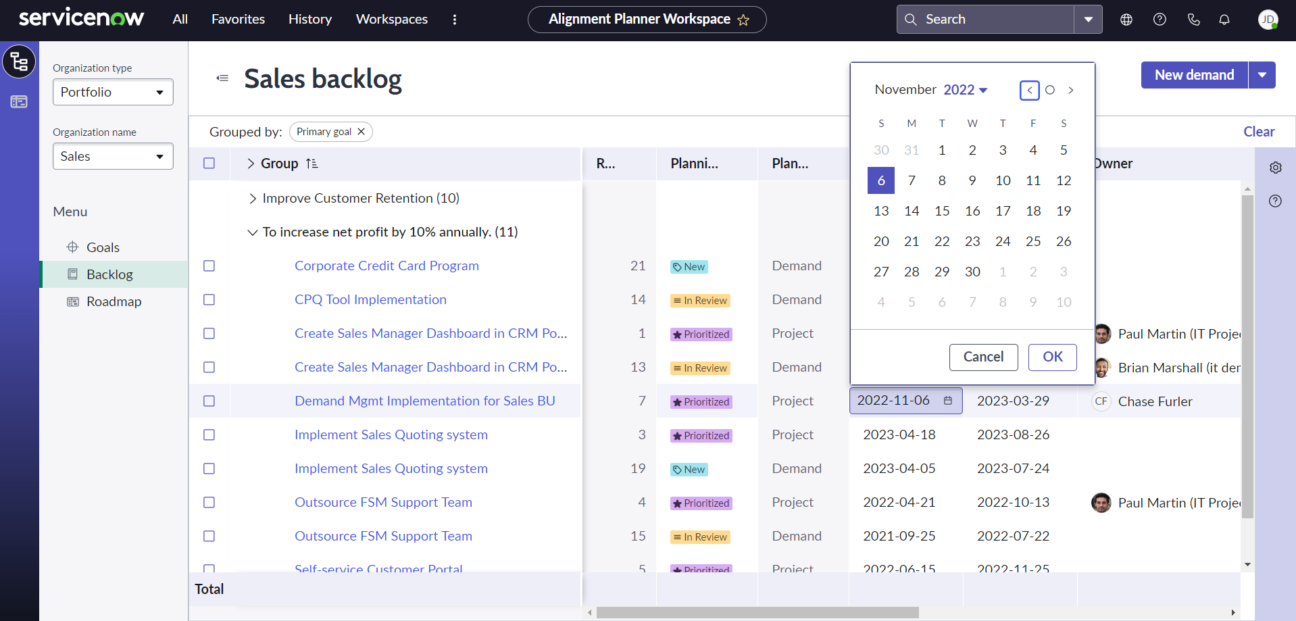
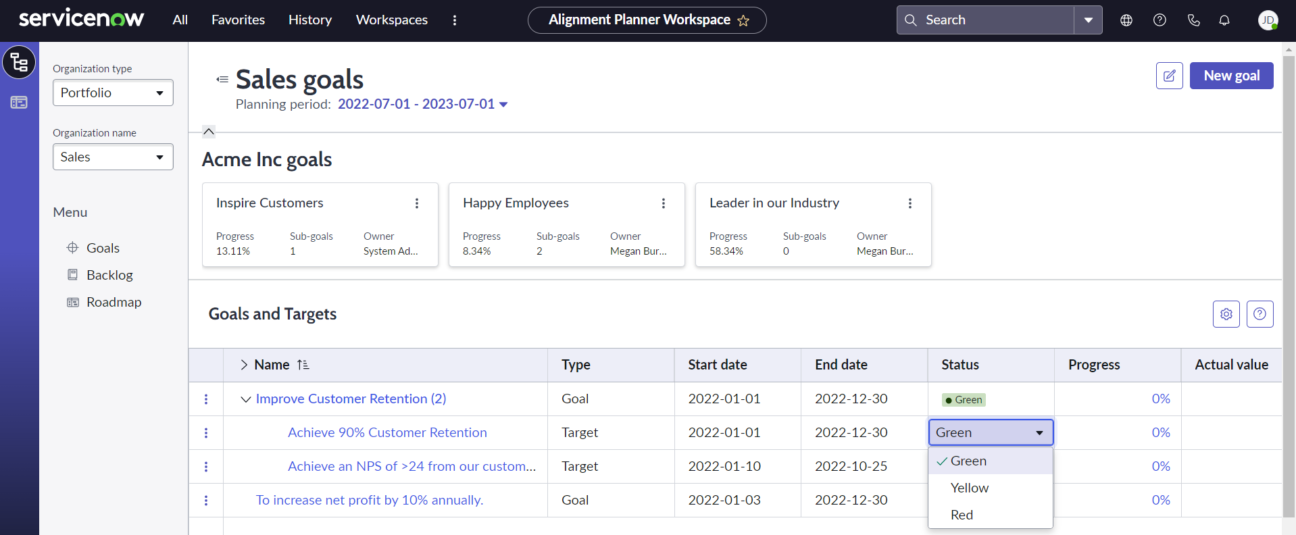
A cherry on top: The recently introduced Goal Framework is perfectly integrated with the Alignment Planner Workspace. This allows the creation of a comprehensive view of all initiatives (Projects, Demands, Epics, etc) and their associated Strategies, Goals, and Targets.
Project Workspace
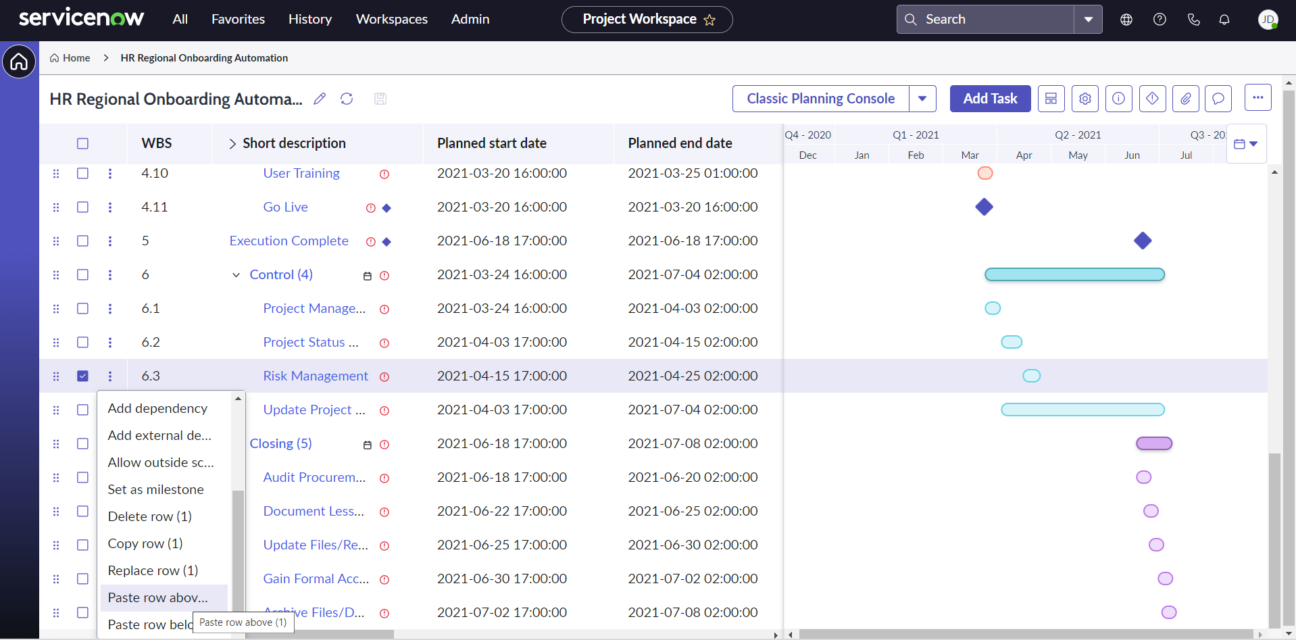
Likewise, the Project Workspace, which enables more intuitive project planning, is receiving more features at the right-click of your mouse. It now supports creating external project task dependencies and clicking through to quickly view these other dependent projects’ planning.
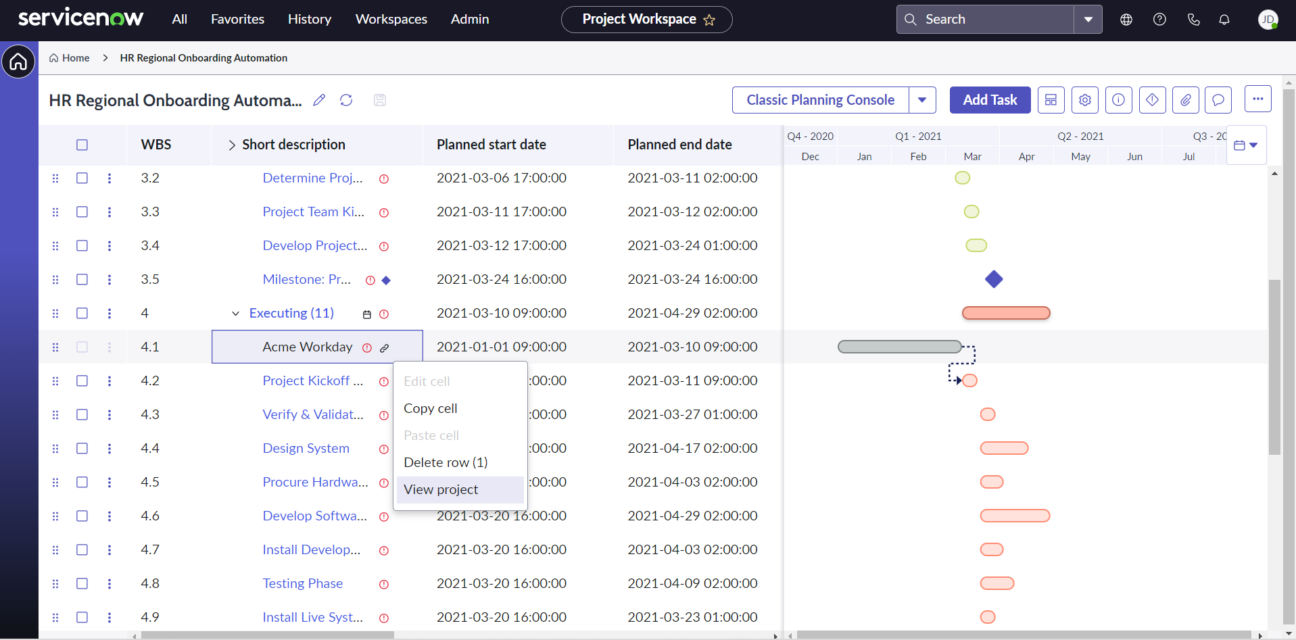
Additionally, there is also extended support to control the tasks of the Gantt chart (indent and unindent). It helps to recreate the project plan’s structure faster and easier.
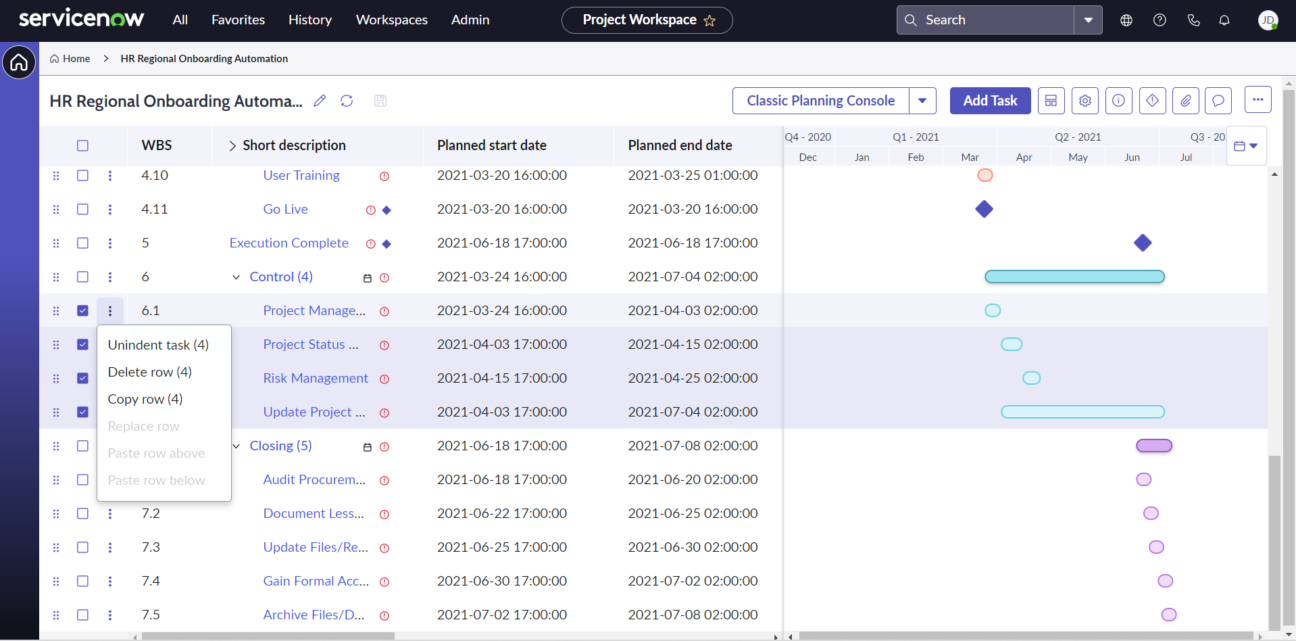
And last but not least, a feature requested many times by our customers, it now allows us to copy and paste tasks above or below the existing ones!
Project Financials
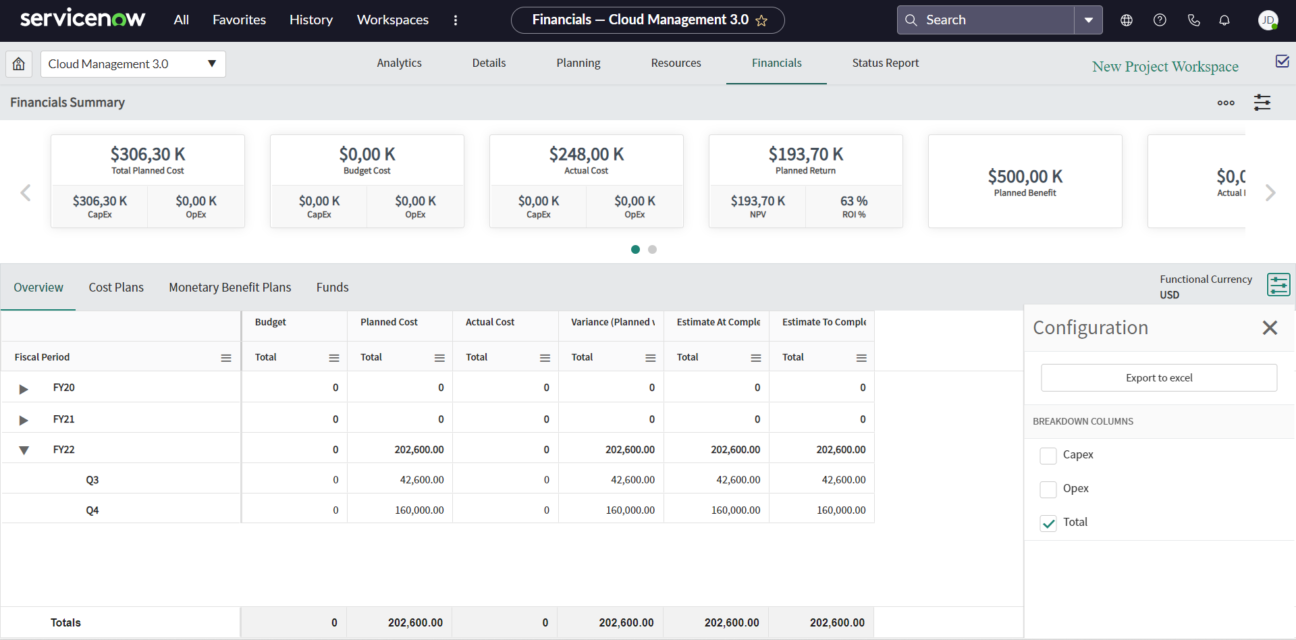
The Project Financials Overview dashboard has been improved to be clearer and more transparent in terms of financial breakdowns. It now provides a condensed view of fiscal years, broken into quarters, displaying the Budget, Planned & Actual costs as well as Variance and the Estimates at/to completion, in one single view.
Agile & SAFe Boards
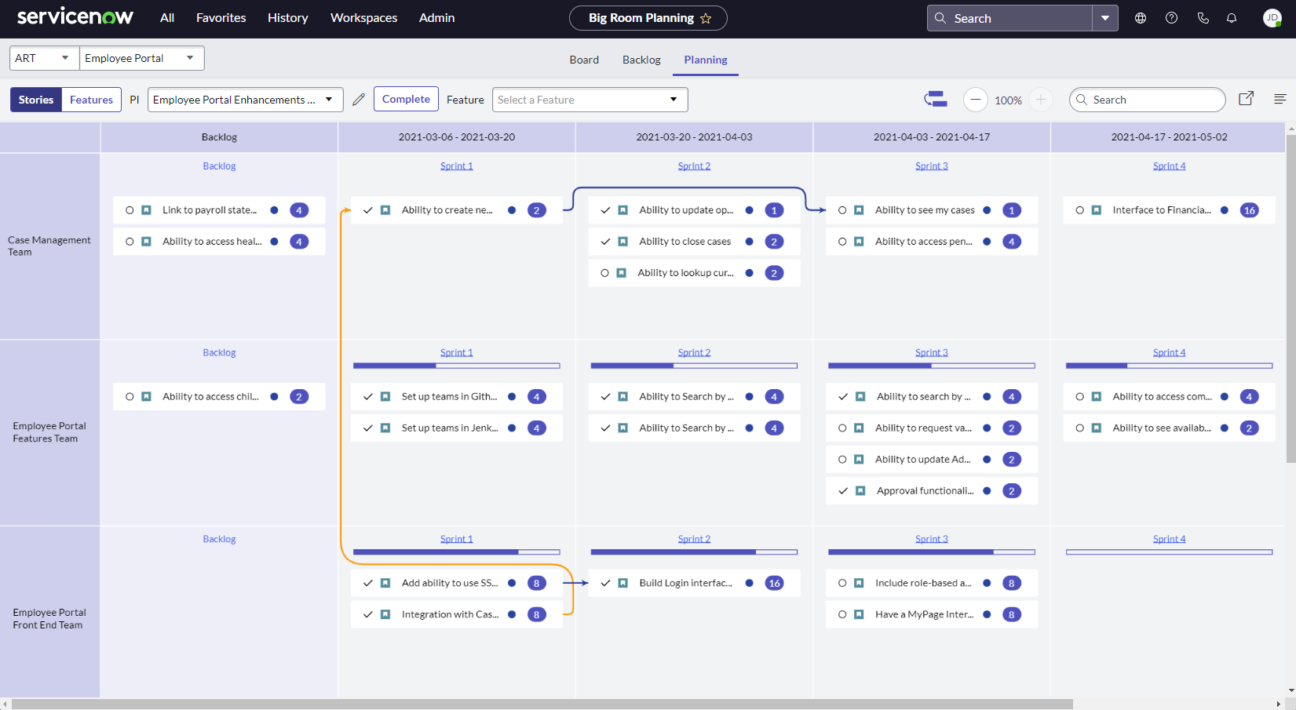
Agile and SAFe dashboards are now available under the new Workspaces experience. It provides new consistency to the ServiceNow platform business users while keeping all previous beloved features. It is now easier than ever to operate within an Agile environment with a clear view of team backlogs, sprints, and individual stories.
The new Agile Board is still compatible with a range of useful plugins such as Scrum Programs (to manage multiple teams and their dependencies), Unified Backlog (to add other records such as incidents or tickets to your Agile Backlog), or Test Management 2.0 (to keep an eye on and document the ever sensitive testing steps of developments).
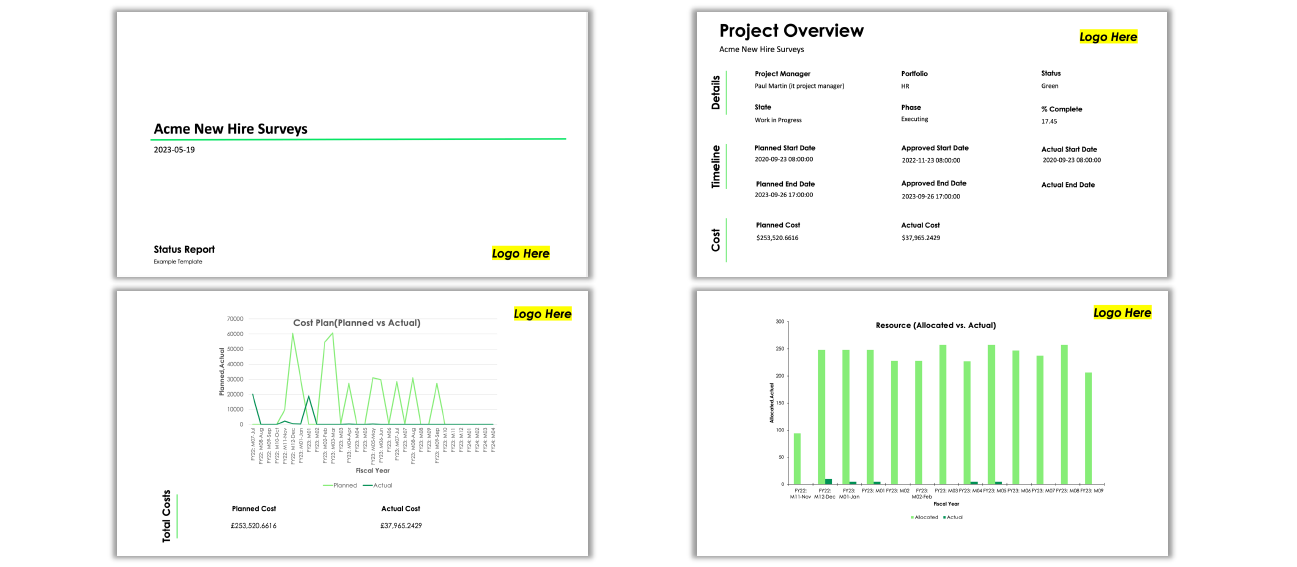
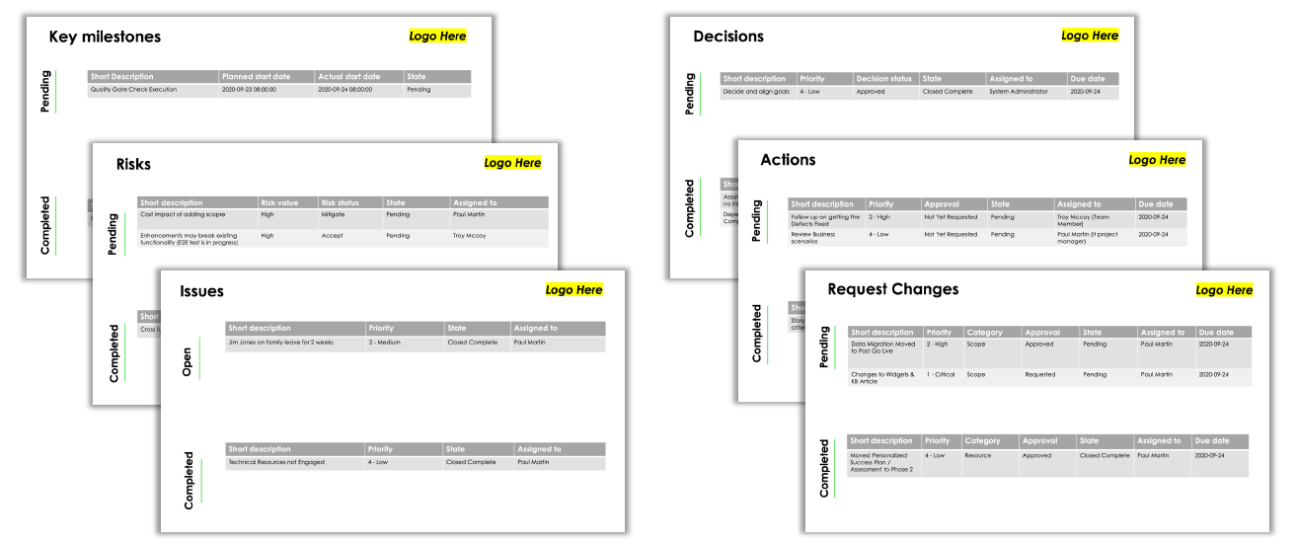
Exports to PowerPoint
Here we are! You can now quickly generate custom-branded status reports, in Microsoft PowerPoint format, for ease of communication and alignment with your business stakeholders. No more struggle to screenshot your project status reports, it is also the end of your fight to get executives to have a look at your ServiceNow Dashboard.
A native ServiceNow to PowerPoint feature allows you to quickly generate decks through tailored branded PowerPoint templates. This leverages a clean and robust out-of-the-box Status Report template to be easily shared with stakeholders.
Add some quick automation capabilities to that and you might end up with an automatically generated PowerPoint deck, ready to use for your steering committee, in just a few seconds each week/month.
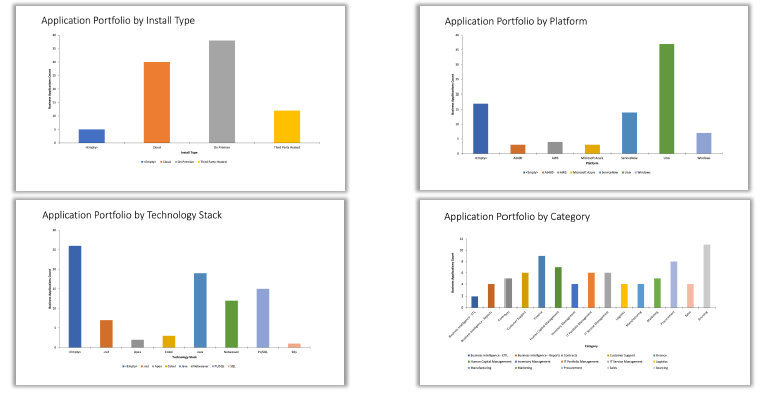
An Application Status Report can also be generated out of ServiceNow so it can be used later on when analysing the Enterprise Architecture of an organization.
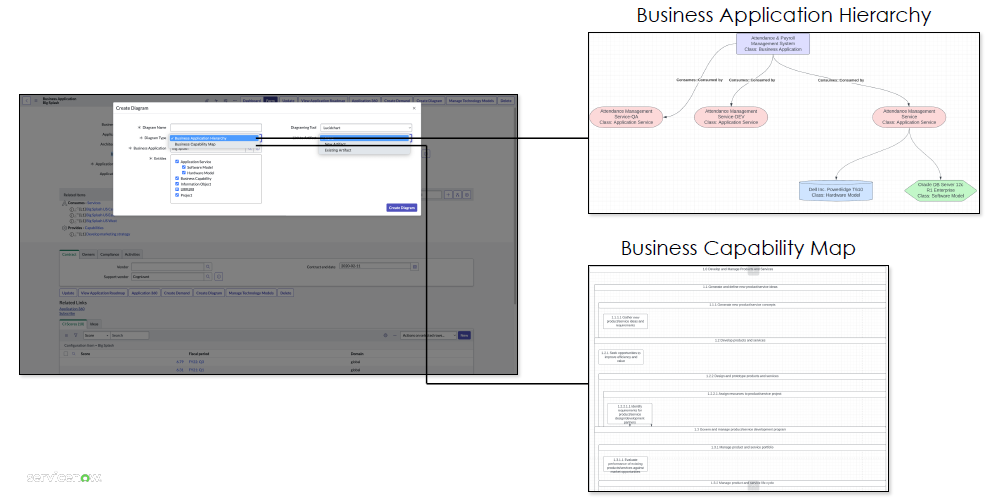
Lucidchart Integration
Another frequently asked integration is here! The new Tokyo release enables Enterprise Architects and Solution Architects to leverage the Lucidchart diagram solution. This means that you can now synchronize service models (Business Application Hierarchy) and capability models (Business Capability Map) from your ServiceNow CMDB straight to Lucidchart for enhanced diagrams based on the recognized ServiceNow CSDM (Common Service Data Model). You can also directly update existing artefacts and create new ones.
Conclusion
The Tokyo release, for ServiceNow Strategic Portfolio Management, continues to improve the customer experience, which started in the last San Diego release. This will bring better user satisfaction through more intuitive, interactive and efficient products. The focus of this release is clearly on reporting and data visualisation.
Don’t hesitate to contact us to receive the most recent information regarding ServiceNow and its products. Feel free to reach out if you are interested in a demo or professional services.

